- Moon: Excellent view, great contrast on the craters. I plan to look at it with a lot more detail.
- Saturn: I was able to see the rings without a problem. I still wasn't able to see the Cassini Division, but I'll keep trying. I was able to see a bit of the texture of the planet, but it's mostly a small white ball. I was also able to see one of the moons of Saturn (Dione, I believe).
- Mars: I've seen it without much detail, because right now it is way up in the sky and therefore a bit uncomfortable to watch. Still, it is rather small, and the only detail I was able to see was that it was only partly lit by the Sun.
- Orion Nebula: You can see the trapezium cluster without a problem, as well as the nearer 3 stars. But the nebula itself is rather faint, and you can only see the brightest part. And even that is only a small blur.
Thursday, June 30, 2022
What can you see with a 60mm telescope?
Like every other geek, I love astronomy and most things related to space. I never truly pursued this topic, apart from the odd article on NGS, but now I get to use a telescope on the weekends.
The telescope ain't that much, but it ain't that bad either. It's a 60mm Konus, with equatorial mount and a motor (which basically means I can point at an object, turn on the motor and the motor will make up for Earth's rotation).
One of the things I would like to know is what can you see with such a telescope. Oddly enough, I still wasn't able to find a comprehensive list on the net... so here's what I was able to see so far: (I've only used the telescope 3 times, so I hope the list will grow in the future!)

Beryl: Desktop Fireworks
If you want to make your Ubuntu desktop really come to live, Beryl is the answer. It's an accelerated OpenGL desktop manager that gives you a lot of bells and whistles visual feedback on your window manager operations.
Installing is not as simple as you might wish, but it isn't too hard either. On the Beryl wiki there's an entry on how to install Beryl on Ubuntu and you can basically follow that.
The only notes I have on the installations steps are:
I had an error message while starting Beryl. As a consequence I had no window manager! The message was:
beryl: No GLXFBConfig for depth 32After doing some searches on the web I found a post that gave a solution to this problem. Just add the following to "Device" section on your
/etc/X11/xorg.conf file:
Option "AddARGBGLXVisuals" "True"
Option "DisableGLXRootClipping" "True"
Also I skipped the entire "Configuring Beryl" section and just added
beryl-manager to my Startup Programs in System > Preferences > Sessions
Next you have to configure Beryl. There's a ton of options, animations, keyboard shortcuts, themes, etc, etc that you can tweak with to make your desktop look exactly like you want it to! And if you have a bit of patience and 28Mb of spare memory to run Beryl, it's really worth the trouble.
Tuesday, September 16, 2014
Building a mobile agenda for JSConf
[Update: Sorry for the missing pics... Deleted by accident. Thank you google...]
A couple of OutSystems' engineering guys were going to a JSConf Europe conference this weekend. While looking for the schedule, they found this:

We just couldn't let this opportunity go by, so João Neves used Platform 9 (which is about to be released) to build an agenda for the event. You can find the application here. It gets the Agenda from google docs using the new REST capabilities, and it is a completely mobile ready!
And, since on the week before I was playing with the source code of OutSystems Now, I built an application for Android that would allow attendees to view the schedule of the conference on their devices, even if offline (source code here).
The results were pretty cool! At the time of writing, 125 people had installed the Android App and we a bit over 7.500 pageviews! And we had some good reviews! :)


A couple of OutSystems' engineering guys were going to a JSConf Europe conference this weekend. While looking for the schedule, they found this:

We just couldn't let this opportunity go by, so João Neves used Platform 9 (which is about to be released) to build an agenda for the event. You can find the application here. It gets the Agenda from google docs using the new REST capabilities, and it is a completely mobile ready!
And, since on the week before I was playing with the source code of OutSystems Now, I built an application for Android that would allow attendees to view the schedule of the conference on their devices, even if offline (source code here).
The results were pretty cool! At the time of writing, 125 people had installed the Android App and we a bit over 7.500 pageviews! And we had some good reviews! :)


Saturday, April 26, 2014
Star Wars stop motion
Some fun with the kids, using discount animation software (the movie is in Portuguese...):
If you're curious, we used iStopMotion to record the video using an iPad camera, ToonBoom to add the lasers, QuickTime to record the sound, and iMovie to assemble everything. Extra videos and sounds downloaded from the internet.
If you're curious, we used iStopMotion to record the video using an iPad camera, ToonBoom to add the lasers, QuickTime to record the sound, and iMovie to assemble everything. Extra videos and sounds downloaded from the internet.
Sunday, February 23, 2014
Displaying discrete data in R
Suppose you have a restaurant, and you do a survey where your customers can grade from 1 to 5 several aspects of that restaurant. The 1st 5 lines on your data will look something like:
To analise this data, what I would usually do is check the mean, standard deviation, maybe do some histograms, and maybe do a boxplot of the data.

But when you have small amounts of data, these approaches tend to hide the story. An alternative option is to use a beeswarm chart:

This type of chart shows the entire dataset, allowing you to see everything at a glance!
If you're using R, you can create these charts using the beeswarm package. You can find the code that built this chart here (it also uses the reshape package).
| Food | Drinks | Location | Service | |
|---|---|---|---|---|
| 1 | 4 | 2 | 5 | 5 |
| 2 | 4 | 3 | 5 | 4 |
| 3 | 5 | 4 | 5 | 4 |
| 4 | 3 | 3 | 5 | 4 |
| 5 | 4 | 2 | 5 | 3 |
To analise this data, what I would usually do is check the mean, standard deviation, maybe do some histograms, and maybe do a boxplot of the data.
But when you have small amounts of data, these approaches tend to hide the story. An alternative option is to use a beeswarm chart:
If you're using R, you can create these charts using the beeswarm package. You can find the code that built this chart here (it also uses the reshape package).
Tuesday, December 31, 2013
Circular Menu with D3.js

Right now the menu only works for 6 slices, but let me know if you need other number of slices.
Check the github page for more details on how to use the WheelMenu and for access to the source code. If you're using the OutSystems Platform, head over to the community and download the component.
Credits to the WheelMenu original design go to Tiago Simões and Daniel Nobre.
Sunday, October 6, 2013
D3 drag and drop tree

Anyway, although the code is far from decent and the tree is still work under progress, I decided to make it available to whomever wants to use. I hope it's useful for you, and be sure to let me know if you have any problems.
More info and download at github!
Saturday, August 17, 2013
Automatically building a cache manifest file

Simple applications, with an HTML file, a couple of JS and CSS files are not a problem. But as soon as you move to more complex applications, the number of files explodes - think imported CSS files, background images, images within your page, etc. So here's a little help to build your cache file!
1. Start by getting the offlineHelpers.js file and put it on your website. It's easier if you put it on the folder of the page you want to cache, but you can put it anywhere. If you don't have a site yet, download the whole project and play with the provided test.html file.
2. Be sure the page you want to cache includes jQuery. This is only needed to run the offlineHelpers script, you can remove it afterwards. You don't even need to download it, just src the script from here: http://code.jquery.com/jquery-1.10.1.min.js
3. Launch chrome (yes, for now it only works on chrome). Load the offllineHelpers script by opening the console (cmd+alt+j on the Mac) and typing $.getScript('offlineHelpers.js'). Next, call offlineHelpers.getCacheFile() on the console.
4. Calling getCacheFile should result on a bunch of debug lines (in gray) followed by your cache manifest file. Something like:
Getting stylesheets
Found an import: jumbotron-responsive.css
Getting JS files
Getting Image files
CACHE MANIFEST
# CSS Files
css/bootstrap.css
img/glyphicons-halflings.png
img/glyphicons-halflings-white.png
css/jumbotron-narrow.css
css/jumbotron-responsive.css
# Javascript Files
http://code.jquery.com/jquery-1.10.1.min.js
# Image Files
img/creatures.jpg
Next, tweak the result and copy to your cache.manifest file.
Let me know how this worked for you! If the script missed a file, let me know on the comments and I'll try to fix it!
Thursday, July 19, 2012
Command line script to batch convert images
Ever had a folder full of images that you needed to convert? Well, today I had a couple hundred 20Mb RAW images that I wanted to convert to JPG, and I really didn't want to open them on an image editor.
So I went hunting for a way to convert the images using the command line on the Mac. Here's what I found:
1. Converting an image via command line: There's a tool called "sips" that does this (and much more) on the mac! To convert a file from RAW to JPG, you just need to call something like:
So I went hunting for a way to convert the images using the command line on the Mac. Here's what I found:
1. Converting an image via command line: There's a tool called "sips" that does this (and much more) on the mac! To convert a file from RAW to JPG, you just need to call something like:
sips -s format jpeg IMAGE.NEF --out IMAGE.jpg
2. Getting the right name: Iterating a list of files via command line is easy, getting just the filename in order to change the extension requires google! Here's how to do it:
for i in *.NEF; do echo "${i%.*}.jpg"; done
(curious on how it works? Check this doc)
3. All together now: To convert all the files in the current directory, do this:
for i in *.NEF; do sips -s format jpeg $i --out "${i%.*}.jpg"; done
Let me know how the script worked out for you!
Sunday, May 20, 2012
Moving from iPhoto to Lightroom
I've been using iPhoto since I bought my mac, but lately it seems to be getting slower and buggier... Takes ages to launch, search doesn't work properly, and my library of about 25,000 photos seems too much for it. So I decided to try Lightroom.
Unfortunately, there's no easy way to get out of iPhoto, be it for Lightroom, Picasa, or whatever... There's no simple way to export all of your events into nice subfolders! So I built my own way out!
I created a python script that reads the data from iPhoto, and uses it to create a tree structure with year/name_of_event and all the photos inside. Here's a screenshot of the script running:

To use the script, download it from here, and execute it via the terminal using:
python iphoto-to-folders.py [AlbumData.xml] [destinationDir]
[AlbumData.xml] is a file inside your iPhoto library, and can usually be located at ~/Pictures/iPhoto\ Library/AlbumData.xml
[destinationDir] is the folder where you want your photos to be copied to.
A couple of notes about the script:
Unfortunately, there's no easy way to get out of iPhoto, be it for Lightroom, Picasa, or whatever... There's no simple way to export all of your events into nice subfolders! So I built my own way out!
I created a python script that reads the data from iPhoto, and uses it to create a tree structure with year/name_of_event and all the photos inside. Here's a screenshot of the script running:

To use the script, download it from here, and execute it via the terminal using:
python iphoto-to-folders.py [AlbumData.xml] [destinationDir]
[AlbumData.xml] is a file inside your iPhoto library, and can usually be located at ~/Pictures/iPhoto\ Library/AlbumData.xml
[destinationDir] is the folder where you want your photos to be copied to.
A couple of notes about the script:
- It only copies the original versions of the photos. Changes you made in iPhoto are not copied.
- It copies all the files from your iPhoto library, so it needs quite a bit of disk space.
- It may take some time to run. To copy my 25.000 photos it took 1.5 hours
- It's not supposed to mess with your iPhoto library, but do make backups!
- It has no warranty whatsoever!
- It's supposed to be tweaked! If you're comfortable with python, adapt the script to your needs.
If you have any questions or spot some problems, please submit them here. And be sure to leave a comment telling me how the script worked for you!
Wednesday, March 21, 2012
Delay your project, protect your future
One of the dangers of Agile is that teams are so busy sprinting and delivering potentially shippable projects, that they forget to invest in becoming more productive in the future.
Let's use some basic economics to illustrate this problem. Assume your team has a top productivity of X. It doesn't matter the unit you pick - story points per iteration, function points per month - but let's assume your team cannot produce more than X.

Now, one of the things you can do with productivity is move it around. For instance, google allows employees to invest part of their work week on pet projects. So if we put that on a vertical axis, we get something like this:
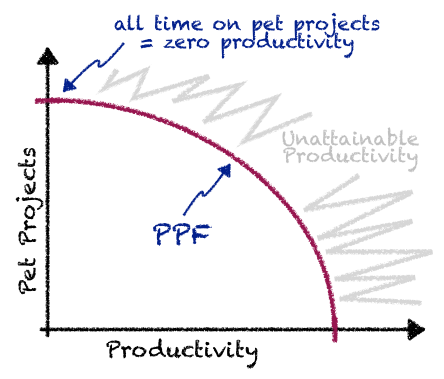
This curve is called a Production Possibility Frontier, or PPF, and it represents your team's limit in terms of productivity. This means the only way you'll make your team more productive is by moving the PPF! And the way to achieve this is through investment.
You may argue that google pet projects are an investment, but what I mean is direct investment in improving productivity. For instance, you could invest in improving your QA infrastructure, so that developers don't spend so much time building and fixing tests. Or you could invest in tools to improve your overall capacity to deliver, like the OutSystems' Agile Platform. (disclaimer, I work for OutSystems! ;).
When you do this type of investment, the end result is that you move the PPF to the right, therefore increasing your team's capacity to deliver.

Turns out there is a catch. These improvements are not continuous, and work in leaps. This means you need to go all the way to see the results of your investment. If you study a new tool for a couple of weeks and stop the investigation before something actionable comes out of the study, you're just throwing your time and money out the window...
But guess what happens as soon as a the project stars to slip? We choose the short term solution, and increase the productivity of the team at the expense of our investment.
Standing up to your stakeholders and delaying a milestone to protect your future is the hard part in making your team more productive. And I hope this short post gives you a bit of ammunition to go in the right direction! :)
Tuesday, February 21, 2012
Why developers suck at UI design

At a certain point he alerts for the fact that developers tend to make this mistake because developers are worried about edge cases - "what if the connection to the database is broken", "what if the user isn't logged in". I agree with this, and I believe this is one of the reasons developers tend to make interfaces that are overly complicated for the common use case.
The solution seems easy, right? Developers need to take a step back from their work, look at the user-stories they captured from their users, make the most used features really obvious, and hide the rest of the clutter.
Well, nothing fundamentally wrong with this approach. I believe developers must deliver the best possible interface they can, and that requires effort and training. But I don't believe this is enough.
The problem is, when you dive as deep as a developer does on the project, it's very hard to step back and take a look at the big picture. What developers really need to do is get someone from the outside to spot the obvious errors that are just too evident to be seen by someone buried in the nitty gritty details of a project.
Again, this sounds like a simple enough solution. After all, getting someone to comment on your work isn't really hard, is it? Specially if it's about design! But the problem is that most developers don't know how to listen or how to act on the feedback they receive. It's the "what if" problem again... it's really easy to dismiss feedback based on edge conditions that happen 1% of the time. (This makes a great topic for another blog post, and I urge you to write it!)
In the meantime, no time like the present to become better at UX design. Here's an interesting webinar with "6 steps to engineering awesome user interfaces". Have fun!
(disclaimer: this is a webinar recorded by me for OutSystems, the company I work for)
Monday, October 3, 2011
DIY tripod for the iPhone
Do you need to make a short video explaining how to do something with your hands? A drawing, assembling some lego, playing with your Nintendo DS? Well, I needed, and since the only video camera I have is my iPhone, I needed a tripod for it. So here it is, my homemade iPhone tripod!


Monday, September 26, 2011
Converting a list of IP addresses to countries

Start by downloading the GeoIP City database from MaxMind. They have a free version that you can download here. Download the one in binary format, and uncompress it.
Next, you need the library to access this database format. There's a pure Python library called pygeoip that you can download from google code. To install it, just uncompress it and run the installer: sudo python setup.py install
Next, you need to build a small script to convert the IP addresses to countries. Here's the script I used (note that the countries database should be in the same directory as the script).
#!/usr/bin/env python

import pygeoip, sys
gi = pygeoip.GeoIP('GeoLiteCity.dat')

for line in sys.stdin:
	rec = gi.record_by_addr(line)
	print rec['country_name']
I used this script (geo.py) by copying the IP list from excel to a plain text file (ips.txt), where you get one address per line. Then just run it with something like python geo.py < ips.text and you get a list of countries on your terminal window. Copy/paste to excel and you're done!
If you want more than just the country, just play a bit with the print line. Here's a variation I did to get the state and the city. The output is tab separated so that you can copy it easily to excel:
#!/usr/bin/env python

import pygeoip, sys
gi = pygeoip.GeoIP('GeoLiteCity.dat')

for line in sys.stdin:
	rec = gi.record_by_addr(line)
	print rec['country_name'] + '\t',
	if rec['country_code'] == 'US' and 'region_name' in rec:
		print rec['region_name'] + '\t' + rec['city']
	else:
		print '-' + '\t' + rec['city']
As a side note, I tried another database from hostip.info, but it was only able to convert about half of the IPs I threw at it, so I recommend going with the one from MaxMind...
Wednesday, August 10, 2011
Mobile Trends and Numbers - Infographic
Here's an infographic that I designed for OutSystems. It shows some of the impressive numbers around mobile adoption and mobile in the enterprise:

Wednesday, January 19, 2011
What's wrong with ScrumBut?

On one side, I get people that say you've got to follow all the rules. That's what SCRUM is! There is no but!
On the other side, I get people saying that there's no such thing as a one size fits all methodology, so you always need to adapt SCRUM for your particular scenario.
Now, I don't agree that you need to blindly follow all the rules of SCRUM. That's not Agile at all... remember the 1st rule in the Agile Manifesto? "Individuals and interactions over processes and tools". Seems clear to me that, if your team agrees that some part of SCRUM can be improved, the Agile Manifesto is there to back you up.
But...
Just because it is ok to change SCRUM, doesn't mean you should. Failing to properly implement SCRUM is not a valid excuse to change the process "to fit your organization". That's the the type of attitude that gives ScrumBut a bad name!
Before adapting SCRUM to your organization, you need to implement and use original SCRUM for a while. It's only when you finally get SCRUM running smoothly on your organization (and that will take some time!) that you and your team can move to phase 2: Analyze the process, do retrospectives, and improve the process to better suite your needs.
And that's when the real fun of Agile and SCRUM begins!
Saturday, June 26, 2010
Giving Gantt charts some Agile love!
Gantt charts have a really bad reputation these days. They're strongly associated with the waterfall methodology, are considered an evil tool that managers use to micro-manage teams, and are usually classified as outdated delusions of certainty about projects that are subject to lots of change.

But still, I love Gantt charts! They're a great way to keep everybody in synch with the overall timeline of a project, team allocation, and how the project dates relate to other important dates.
My secret to make Gantt charts successful is easy: Keep It Simple!
Here are a few tips on how to achieve Gantt Nirvana:
Here are a few tips on how to achieve Gantt Nirvana:
- You have to be able to produce the Gantt really quickly. The problem with most Gantt charts is that creating them is a project in itself. And that means that by the time you publish them, they're already out-of-date.
- It must be really easy to change the Gantt. The Gantt's main purpose is communication. So when the project changes, the Gantt must also change.
- Gantt's don't work well with lots of data. Forget about the never-ending WBSs. It's too much detail and too much work. User stories are more than enough detail.
- Assign to teams, not individuals. It's up to the team to organize how they solve problems. Besides, it means a lot less work for you!
- Gantt's don't scale well vertically. Don't make a stair case of user stories if they all belong to the same project. Show them one after the other, with the most important first, of course!
- Be precise. There's not much point communicating something that's wrong. Take into account the team velocity, vacations, national holidays, ...
- Add milestones and releases. Make it obvious when things will be made available. Just because a user story is completed next week, that doesn't mean it will be available in production.
- Worry about the future. Retrospectives are important learning tools, but usually it's more important to communicate were we are heading. Focus on that.
At OutSystems, we used our own Agile Platform to automate the entire process of creating the Gantt. All I have to do is click a button, and hey presto! Here's how they look:

Sunday, May 23, 2010
Beating the Delivery Deadline!

I'm a product delivery manager at OutSystems. In a nutshell, my job is to make sure new versions of the Agile Platform are released on time, with quality, and with all the features agreed upon.
Last Friday we released version 5.1 beta of the Agile Platform! And yes, it was released on time, with quality, and with everything the stakeholders were expecting! Cool, hum?
And if you're wondering, this wasn't a one time lucky shot. This is the 4th version since I'm a delivery manager that we've pulled this off!
Actually, this shouldn't be anything to be amazed about... But the fact of the matter is that it is so unusual, that it surprises most people I know in the software industry. So I decided to share some principles I follow to make sure we ship on time:
- Embrace change: One of the most anticipated features on 5.1 are the Wizards. Funny enough, the wizards weren't part of 5.1 when it started! This could've been a major stress factor, but it wasn't! From the moment we understood it was the right decision, we were more than thrilled to make it happen!
- Don't add, swap: It's really easy to add a bunch of features to a version, just so see its ship date delayed over and over. Swapping puts a price on features and forces everyone to prioritize. This keeps everyone focused on shipping the most important things first!
- Say 'No': It happens on every version. The end date gets near and everybody wants to add just one more thing. It's much easier to say "yes", but you'll regret it for much longer. I usually put it like this: Is it worth it to miss the ship date to add this last minute feature? It usually isn't...
- Know your teams: 5.1 got out on time because we were able to predict how long it would take to build! And the reason we were able to predict this (even with so much change!) is because we studied past versions to learn how long we take to do stuff. And not just the time software takes to build, we also consider interactions with other teams, user feedback, meetings, ...
- Establish design rules: It's really easy to derail when developing software. Establishing good design rules (visions, goals, guidelines, ...) is a great way to make sure everyone is on the same page. To be honest, I usually don't come up with these rules. The teams do! I just help teams stick to them.
- Get out of the way: I'm always available to give help and advice to my teams. But once I feel they're on track, I get out of the way. This is actually much harder to do than it seems, but once you have this level of trust with your teams, it's pure bliss - for both the manager and the team!
- Ship: There's always last minute bugs. There's always a reason to stop the presses and hold the version. Turns out most last minute bugs only occur when the planets are aligned and it's raining in the Kalahari... so ship anyway! You can fix it tomorrow!
These might seem like easy enough tips, but to each of them there's a lot of preparation, trust, and discernment going on! Not only that, there's a huge requirement to make any of these tips work:
You need amazing teams working with you!
Lucky for me, I work with the best teams on the planet!
Sunday, April 25, 2010
It's not about the numbers!

When the company grows, formalism starts to impose itself. Some evaluation forms (aka Excel files) appear, and goals and metrics are agreed upon. Still, when evaluation time arrives, everybody is very well aware that things changed since the day the goals were written, and a more qualitative approach is used once again.
When the company gets big, people don't know each other so well, and they don't have all the organization's context at the top of their heads. To make sure everybody is aligned and working for the same grand objective, metrics are put in place. Big mistake!
Don't get me wrong. Metrics are good. The problem is turning metrics into goals and evaluations. Once you do that, people will try to make the number blindly, even if they have to go against the organization's best interest. To put it a single sentence:
Metrics are tools, not goals!
As with every tool, some care must be taken with metrics. Here's a few hints to make sure your metrics are helping you:
- Understand the metric: Not only the formula to obtain the metric, but why are you getting the current values.
- Question the values: It's really easy to measure wrong. Check your numbers. Measure twice, cut once.
- Question the metric: Don't assume the current metric is adequate. Mistakes are made. Things change. More information is available. Be extra critical with metrics!
- Study the derivative: More important than the number, is the derivative. More important than knowing the current numbers, is knowing next month's.
- Don't trust all stats: You need a big sample of values to trust statistics. Don't trust averages and the like if the sample is small.
- Don't use metrics as a direction: Use them as guidance.
- Talk to people: Don't trust yourself to analyze the results. Talk to the people that measure. Talk to the people that affect the metric.

I'm sure the list goes on and on. What is your advice for working with metrics? Do you have any stories of metrics gone wrong?
Sunday, November 1, 2009
Sprint review meeting: It's all about Marketing!
It's not that the team hasn't done a great job! Quite the opposite. The teams I work with do miracles! But, like most engineers, they sell themselves short.
Sprint Review Meetings are all about Marketing! Your team needs to sell the work done during the Sprint to the audience!
Here are a few tips to effectively market your work:
- Show the value of what you did: Don't explain how you did it, and don't go into excruciating technical detail about what you implemented... explain the benefits of what you did!
- Do: "By improving the reticulating splines performance, customers have a much smoother checkout process"
- Don't: "We improved reticulating splines speed by using a really smart b-tree structure"
- Make a big fuss about what you did: Don't hide the great work you did in a bullet list with all the details of the Sprint. Pick 3 to 5 key points, and make a slide for each of them.
- Do:

- Don't:

- Make a real world demo: Be smart with your seed data. Use real data whenever possible, or some really clever examples to make your demo more effective.
- Do: "Peter Smith bought a Mega Chair and paid it with a Visa card"
- Don't: "Customer A bought Product 1 and paid with card X"
- Talk about the entire Use Case: Even if you don't demo it all, explain how the user got to the point of the demo and what the user is trying to achieve. It will make understanding your demo much easier.
- Do: "Peter Smith was navigating at our web site to buy a chair. He did a search for chairs, and clicked the 1st result on the list. What you see here is the page present to him at that stage."
- Don't: "Assume Customer 1 is at this page"
- Make a clean demo: The demo should be as near to reality as possible. Avoid launching the command line, use batch files, or employ other kind of odd gizmos during your demo.
- Don't dwell on what you didn't do: If your team made a commitment to this sprint that it wasn't able to keep, mention it, give a one sentence justification, and move along. Be prepared to answer any questions that may arise, but don't spend the time you have to talk about what you did, speaking about what you didn't do.
What other tips would you add to this list? How do you turn your Sprint Review meetings into huge successes?
Subscribe to:
Posts (Atom)